How to Read Contour Lines: Hills, Valleys and Slopes Explained
To read contour lines, remember one idea: every line joins points of the same height, and the lines are stacked at a fixed height step, the contour interval. Rings mean hills, lines crowded together mean steep ground, wide gaps mean gentle ground, and V shapes show valleys and spurs. Once you see that, a flat topographic map turns into hills and valleys in your head.
This guide explains contour lines step by step with drawings that show each landform twice: as contours on the map and as a 3D view of the same terrain. You will learn to find the interval, tell uphill from downhill, estimate slope angle, choose easier routes and match the map to the ground. It builds on our map and compass guide and is part of the bushcraft basics.
Step by step
-
1

Check the contour interval
Look in the map legend for the height step between two lines – typically 10 m on 1:25,000 maps in Germany.
-
2

Find the index contours
Every fifth line is usually thicker and labelled with its height. Count on from it in interval steps.
-
3

Work out which way is uphill
Height labels rise towards the summit, and streams lie in valleys and always flow downhill.
-
4

Read the spacing
Lines close together mean steep ground; lines far apart mean gentle ground.
-
5

Name the landforms
Rings are hills, an hourglass is a saddle, a V pointing uphill is a valley, a V pointing downhill is a spur.
-
6

Match map and terrain
Orient the map and compare the shapes with what you see around you as you walk.
What are contour lines?
A contour line joins all points on the ground that lie at the same height above sea level. Imagine the sea rising in steps of exactly 10 m and drawing a line along the shore at every step: seen from above, those shorelines are the contour lines. Walk along one and you neither climb nor descend. The short definition is also in our glossary.
Contour lines are the most reliable information on a topographic map. Forest tracks change, clearings grow back and signposts vanish, but hills, valleys and saddles stay where they are for centuries. That is why experienced navigators read the shape of the land first and paths second – and why contours still work in fog, snow and dense forest, when you can see little else.
Four rules explain almost everything:
- Lines never cross or split. A point cannot have two heights. Only at an overhanging cliff can lines appear to touch.
- Each line closes on itself – on the map or somewhere beyond its edge. A small closed ring is a hilltop or, if marked, a hollow.
- The height step between neighbouring lines is always the same on one map: the contour interval.
- Spacing shows steepness. The closer the lines, the more height you gain over the same distance.

Many maps add spot heights – a dot with an exact height on summits or junctions. They fix the height of a hilltop, which the contours alone only give to within one interval.
Contour interval: how much height lies between two lines?
The contour interval is the vertical distance between two neighbouring lines. It is printed in the map legend, often near the scale bar ("contour interval 10 m"). Always check it before you read anything else: the same pattern of lines means twice the height on a map with a 20 m interval as on a map with a 10 m interval.
The interval depends on the map series and the terrain. Flat country needs a small interval, otherwise there would be almost no lines; mountains need a larger one, otherwise the lines would merge. Some maps add dashed auxiliary contours at half the interval in very flat areas.
| Map type | Typical interval | Index contours | Notes |
|---|---|---|---|
| German TK25 and many 1:25,000 hiking maps | 10 m | Every 50 m | Dashed auxiliary lines may be added in flat ground |
| UK 1:25,000 maps | 5 m in most areas, 10 m in some mountain areas | Thicker every few lines | Check the legend of the sheet |
| US 1:24,000 quadrangles | Often 10, 20 or 40 ft | Every fifth line | Feet, not metres |
| 1:50,000 maps | Often 10 or 20 m | Usually every fifth line | Less detail; small features vanish between lines |
| Mountain and alpine-club maps | Often 20 m | Every 100 m | Rock drawn with its own symbols |
| Map apps | Changes with zoom | Varies | Generated from elevation data; see the app section |
In this guide all drawings use a 10 m interval with a thicker line every 50 m – a common layout on 1:25,000 maps in Germany, and the best scale for walking and bushcraft. If your map uses 5 m, every number about height in this guide halves per line; with 20 m it doubles.
Small features can hide between lines. A bank 6 m high may not show at all on a 10 m map if no contour happens to cross it, and a small knoll can appear as a single tiny ring or not at all. Treat contours as a reliable picture of the big shapes, not of every bump.
Index contours, height labels and which way is uphill
Counting dozens of thin lines would be slow, so most maps make every fifth line an index contour: drawn thicker and labelled with its height at intervals. With a 10 m interval these are the 300, 350, 400 m lines and so on. Find the nearest index contour, then count thin lines up or down from it in interval steps.
The biggest beginner question is not "how high", but "up or down?" A valley and a spur can look almost identical until you know which way the ground rises. Use these clues, ideally two of them together:
- Height labels: the numbers increase towards higher ground. On many maps the top of the number faces uphill.
- Water: streams, rivers and lakes always lie in low ground and flow downhill. A stream running through a V of contours means the V is a valley.
- Spot heights and summits: the smallest closed rings near a spot height are tops.
- Your feet: if you know you are climbing, the lines you cross must lead to higher numbers.
Spacing = steepness: close lines are steep, wide lines are gentle
Because each line marks the same height step, the horizontal distance between lines tells you how steep the ground is. Close together means steep: you gain 10 m over a short distance. Far apart means gentle: the same 10 m are spread over a long distance. Evenly spaced lines mean an even slope.
The spacing also reveals the shape of a slope in profile. Lines that are close at the bottom and wide at the top describe a concave slope: steep at first, then easing off – the summit hides behind the steep part until you are on it. Lines wide at the bottom and close at the top describe a convex slope: gentle at first, steepening as you climb, and from the top you often cannot see the ground right below you. This matters for route choice, for visibility and in winter for spotting where the steep part of a slope lies.
Concave vs convex slope
Concave
- Lines close at the bottom, wide at the top
- Steep climb first, then it eases off
- You can see the whole slope from below
- Summit appears late
Convex
- Lines wide at the bottom, close at the top
- Gentle at first, steepening higher up
- From the top the steep part is hidden
- Take care descending in poor visibility
How to recognise hills, saddles, ridges, valleys, cliffs and depressions
Contour lines form a small set of patterns, and once you know them you can name almost any landscape. Each drawing below shows the same landform twice: on the left as the contour map, on the right as a 3D view seen from the south – from the bottom edge of the map.
Six landforms: contour pattern and 3D view
 1Hill or summit
Closed rings, one inside the other, with the smallest ring at the top. Often a spot height marks the summit. Here the west side is steep (crowded rings) and the east side gentle.
 2Saddle (col)
Two sets of rings joined by lines that bend inwards like an hourglass. The saddle is the lowest point on the ridge between the two summits – the natural crossing point for paths and a good attack point.
 3Spur or ridge
Lines form a U or V that points downhill, towards lower numbers. The ground falls away on both sides of the spur. Ridges and spurs make good handrails and often dry walking.
 4Valley or gully
Lines form a V that points uphill, towards higher numbers. Streams run along the tip of the V, and in a sharp V the stream has cut a steep gully. Springs often lie near the head of such valleys – see finding water.
 5Cliff or steep step
Lines crowd together until they almost merge. Many maps stop drawing contours there and use a black or grey rock symbol instead. On the ground: a drop you cannot walk down.
 6Depression (hollow)
Closed rings like a hill, but the heights fall inwards. Maps mark this with small ticks on the inside of the rings, pointing downhill, or with height labels. Hollows collect cold air and water – poor camp spots.
The one pair beginners mix up is valley and spur, because both are V shapes. The rule is: in a valley the V points uphill, on a spur it points downhill. If you cannot tell which way is uphill, look for water – a stream belongs in a valley, never on a spur.
| Landform | Contour pattern | On the ground | Use for navigation |
|---|---|---|---|
| Hill / summit | Closed rings, smallest at the top | Highest point, views in all directions | Landmark, position check, triangulation |
| Saddle | Hourglass between two sets of rings | Low point on a ridge, often a path crossing | Attack point, crossing between valleys |
| Spur / ridge | V or U pointing downhill | Ground falls away on both sides | Handrail, dry and often wind-exposed |
| Valley / gully | V pointing uphill, often with a stream | Low ground, water, often damp and cool | Handrail, catching feature, water source |
| Cliff | Lines merging, or rock symbol | Vertical or near-vertical drop | Barrier: plan around it, never down it |
| Depression | Closed rings with inward ticks | Hollow without outflow | Distinct feature; avoid camping in it |
| Plateau | Wide empty area inside the top ring | Flat top, few features | Navigation gets harder: use bearings |
Landforms also matter beyond navigation. Ridges and summits are exposed to wind and lightning, valley bottoms collect cold air, mist and the risk of flooding, and hollows hold water after rain. When you choose a camp site, a gentle shoulder part-way up a slope is often warmer and drier than the valley floor. Overhanging cliffs can offer a natural shelter, but check above them for loose rock first.
How to estimate slope angle from contour lines
You can turn line spacing into an approximate slope angle with a ruler and simple arithmetic. The method uses two things printed on the map: the scale and the contour interval.
- Measure along the steepest line of the slope – at right angles to the contours – and count how many lines lie within 1 cm.
- Height: multiply the number of lines by the interval. 10 lines × 10 m = 100 m.
- Distance: on a 1:25,000 map, 1 cm is 250 m on the ground.
- Gradient: height ÷ distance = 100 ÷ 250 = 0.4, which is 40 % or about 22°.
From line spacing to slope angle
 1Count the lines in 1 cm
Lay the ruler of your compass across the contours where the slope is steepest. Here 10 lines cross 1 cm. On a 1:25,000 map with a 10 m interval that is 100 m of height over 250 m.
 2Height ÷ distance
100 m ÷ 250 m = 40 % gradient, which is about 22°. You do not need trigonometry in the field – use the table below or remember a few reference values.
 3Compare with reference values
5 lines per cm ≈ 11°, 10 lines ≈ 22°, 15 lines ≈ 31°. From about 30° upwards a snow slope is avalanche terrain – stay off it unless you are trained.
| Lines per cm | Spacing between lines | Gradient | Approx. angle | What it feels like |
|---|---|---|---|---|
| 2 | 5 mm | 8 % | ≈ 5° | Barely noticeable on a track |
| 5 | 2 mm | 20 % | ≈ 11° | A clear, steady climb |
| 10 | 1 mm | 40 % | ≈ 22° | Steep; slow going off-trail |
| 15 | 0.7 mm | 60 % | ≈ 31° | Very steep; hands useful, avalanche angle in snow |
| 20 | 0.5 mm | 80 % | ≈ 39° | Scrambling ground; lines nearly touch |
Maths: tan(angle) = lines × interval ÷ ground distance. The same values apply to a 1:50,000 map if its interval is 20 m. With a 5 m interval you need twice as many lines for the same angle. "Feels like" is a rough guide for walkers with a pack.
Remember that this gives an average over at least one interval. A slope that averages 25° on the map can contain short steps of 35° or more, small crags and banks that fall between the lines. Use the estimate to compare routes and to spot clearly steep ground, not to judge the exact angle of the slope in front of you.
Choosing a route with contours: ascent, steepness and time
On a flat map two routes may look equally long, but the contour lines reveal how hard they are. When you plan a route, read three things from the contours:
- Total ascent: count the lines you cross while climbing and multiply by the interval. Do the same for the descent.
- Steepest section: where are the lines closest? Is that a short step or a long grind?
- Shape: does the route follow a valley, a ridge or a slope? Valleys mean water and shade; ridges mean views, wind and few streams.

Ascent changes your walking time
Distance alone underestimates your time. Naismith's rule, the basis of our hiking time calculator, allows 1 hour per 5 km plus 1 hour per 600 m of ascent. A route of 6 km that crosses 30 contour lines uphill on a 10 m map has 300 m of ascent: 1 h 12 min for the distance plus 30 min for the climb, about 1 h 42 min of walking before terrain, pack weight and breaks. Enter the ascent and descent you counted into the calculator, and compare the result with the sunset time from the daylight calculator.
Your pace count also changes on slopes: the pace count calculator adds about 12 % uphill and about 25 % on steep uphill ground. Contours tell you in advance where to expect this.
Practical route-choice rules
- Around or over? Contouring – walking around a hill at roughly the same height – is often faster than going over the top and down again, especially with a heavy pack.
- Zigzag on steep ground. Where the lines are close, a path that crosses them at a shallow angle spreads the height over a longer distance. Paths that wind back and forth on the map are doing exactly this.
- Climb early, descend gently. If you can choose, go up the steep side and down the gentle one: steep descents are hard on knees and more likely to cause slips. Trekking poles help on both.
- Use the saddle. To cross a ridge, aim for the saddle – the lowest crossing point.
- Read the valley bottom. A V-shaped valley with a stream often has damp, overgrown ground and may force stream crossings.
Direct line vs following the contours
Direct line
- Shortest distance on the map
- Crosses many lines quickly – steep
- Tiring, slippery when wet
- Fine for short climbs with light packs
Contouring / gentle approach
- Longer on the map
- Fewer lines crossed per 100 m – gentle
- Steady rhythm, saves energy
- Often faster in total with a heavy pack
Relief shading, hachures and contours: what is the difference?
Many maps combine contour lines with relief shading (hill shading): a soft grey shadow as if the sun shone from the north-west, so slopes facing away from it look dark. Shading shows the overall shape at a glance – you see ridges and valleys immediately – but it does not tell you heights or exact steepness. Contours do.

Older maps and some mountain maps use hachures: short strokes drawn in the direction of the slope, thicker or denser where it is steeper. Cliffs and rock usually get their own symbols, and steep banks or embankments may be shown with tick marks along a line. Learn the legend of your map series: the symbols differ between countries.
Matching the map to the terrain: thumbing, handrails and catching features
Reading contours at home is half the skill; the other half is recognising them outside. The method is simple: orient the map, predict, then check. Turn the map so that north points north – by compass or by lining up a path or stream – then look at the contours ahead of you and describe what you should see: "a steep slope on the left, then the path drops into a small valley with a stream, then climbs gently to a saddle." If the ground matches, you know where you are.
Map–terrain matching loop
- OrientNorth on the map points north.
- ThumbKeep your thumb on your position.
- PredictSay what the contours ahead mean.
- CheckRising, falling, steep, flat – does it match?
- Move thumbTick off each feature you pass.
Thumbing means keeping your thumb on your current position and moving it along as you walk, so you never have to search the whole map again. Handrails are long features you can follow without precise compass work – and contour features make excellent ones: a valley bottom, a ridge crest, the foot of a steep slope or the edge of a plateau. Catching features stop you overshooting: if the ground suddenly starts to drop steeply, you have passed the hilltop you were aiming for. These techniques are explained in detail in aiming off, handrails and attack points.
Your legs are a measuring instrument too. If the map says you should climb for 50 m and you are already descending, stop. In poor visibility, at night or in snow, the feel of the slope under your feet is often the clearest clue you have – see moving safely at night. And if nothing matches any more, stop, go back to the last point you were sure of, and if you need help, call 112; our guide to emergency signals explains how to give your position.
The terrain does not match the map – what now?
Is the ground going up where the map says down (or the reverse)?
Yes → You may be on the wrong side of a valley or spur. Check which way is uphill on the map.No → Check the steepness: are you on the right slope but further than you think?Can you see a distinct landform – a summit, a saddle, a deep valley?
Yes → Find it on the map and orient the map to it.No → Walk to a nearby safe high point or clearing for a view, if close.Do you know your last certain position?
Yes → Return to it and start the leg again.No → Stop, think, observe, plan – do not keep walking.
Contour lines in apps and on GPS devices
Most outdoor map apps and GPS units show contour lines, and the same reading rules apply. A few differences are worth knowing:
- Generated from elevation data. App contours are usually calculated from a digital elevation model. They can be smoother or rougher than official maps, and small cliffs or banks may be missing.
- The interval changes with zoom. Zoomed out, an app may show only every 50th or 100th metre; zoom in until you see the fine lines, and check which interval is shown.
- Relief shading and slope layers. Many apps offer hill shading, and some offer a slope-angle layer that colours steep slopes. Useful for planning, but it does not replace avalanche training or the bulletin.
- Elevation profiles. Route planners draw a profile and sum up the ascent. Totals differ between apps because of different data and smoothing – use them as estimates and compare with your own count.
- GPS height is less precise than GPS position. Barometric altimeters are better for small height changes but drift with the weather: reset them at a spot height or a known contour.
Download offline maps before you go – signal often disappears in valleys – and keep a paper map as backup. Our guide to offline maps and GPS covers the setup, and power banks and batteries keeps the phone alive in the cold. When a battery dies, the contour skills in your head still work.
Paper map vs app for reading contours
Paper map
- Whole area visible at once
- Official interval and rock symbols
- No battery, works in rain
- You must find your own position
App / GPS
- Position, profile and ascent in seconds
- Interval and detail change with zoom
- Small screen hides the big shapes
- Battery and cold limit it
Practice exercises at home and outdoors
Contour reading improves quickly with practice, and most exercises need only a map and a pencil. The most useful one is drawing a profile – a side view of the ground along a line. It trains you to see height in the lines and shows exactly where a route is steep.
Drawing a profile from contour lines
 1Draw a line A–B
Pick two points on the map, for example the start and end of a planned leg, and join them with a pencil line across the contours.
 2Mark the crossings on a strip
Lay the straight edge of a paper strip along the line and make a tick wherever a contour crosses it. Write the height next to the index contours and mark A and B.
 3Transfer to a height grid
Draw horizontal lines for each height step on graph paper. Lay the strip along the top and carry each tick down to the line of its height.
 4Join the dots
Connect the points with a smooth line. Now you see the shape: here a steep climb from the west, a rounded summit and a long, gentle descent to the east.
Ten exercises, from easy to harder
- At home: find the interval and three index contours on your local map
- Mark every summit, saddle, valley and spur within 1 km of your home
- Trace one contour line all the way round a hill with a pencil
- Draw a profile of a familiar walk, then walk it and compare
- Count the ascent of a planned route and check it with the hiking time calculator
- Outside: predict the next 300 m of terrain from the map before you walk it
- Walk along a contour on a gentle slope, trying to stay at the same height
- Stand on a saddle or summit and find it on the map without GPS
- Estimate the slope angle on the map, then compare with how steep it feels
- On a foggy or dull day, navigate a short leg using only contour features
A good next step is an orienteering course or a permanent orienteering trail: orienteering maps use very detailed contours and train fast map-to-terrain matching. For a whole practice plan with compass work, see our navigation practice plan, and for the bigger picture explore all bushcraft skills.
Explaining contour lines to kids: the fist model
Children understand contour lines fastest when they can touch them. The classic method needs only a hand and a washable marker:
- Make a fist and hold it knuckles up on the table. The knuckles are the summits, the gaps between them are saddles.
- Draw rings at equal heights: start low around the whole hand, then draw lines higher up, each one level all the way round – like water rising around an island.
- Open the hand and look from above, or keep the fist and look straight down: the lines become a contour map. Around each knuckle there are small rings; around the whole hand big ones.
- Compare with a real map: find a hill with rings like a knuckle and a saddle like the gap between two knuckles.

Two other kid-friendly models: build a mountain from modelling clay in a clear box, pour in water 1 cm at a time and trace each waterline on the clay or on the lid; or cut slices of a potato at equal thickness and stack them back together. Turn it into a game outside – "find the saddle", "which way does the stream flow?" – with ideas from outdoor games for kids and bushcraft with kids.
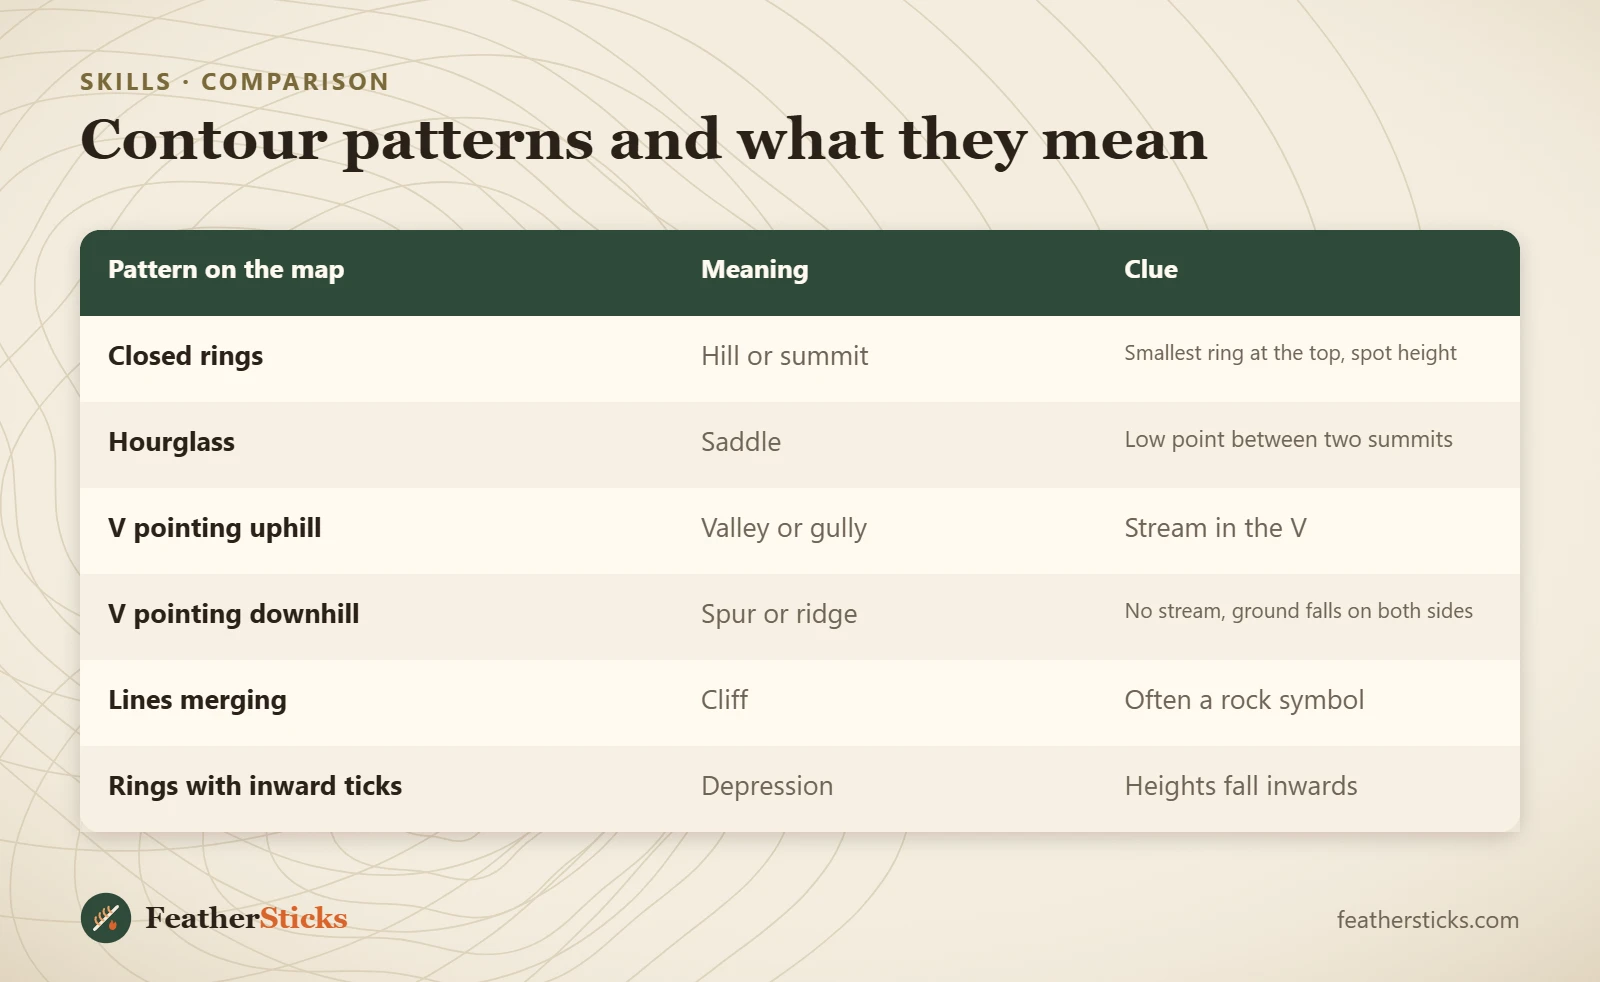
| Pattern on the map | Meaning | Clue |
|---|---|---|
| Closed rings | Hill or summit | Smallest ring at the top, spot height |
| Hourglass | Saddle | Low point between two summits |
| V pointing uphill | Valley or gully | Stream in the V |
| V pointing downhill | Spur or ridge | No stream, ground falls on both sides |
| Lines merging | Cliff | Often a rock symbol |
| Rings with inward ticks | Depression | Heights fall inwards |
Common mistakes
- Forgetting to check the contour interval and misjudging the height of a climb.
- Mixing up valleys and spurs because both look like a V – check which way is uphill.
- Planning by distance only and ignoring the ascent hidden in the contours.
- Trusting the lines to show every small bank or crag that lies between two intervals.
- Treating a map-based slope angle as exact, especially near snow slopes.
- Reading app contours zoomed out, where only a few lines are shown.
- Camping in a hollow or valley bottom that collects cold air and water.
What you need
- Topographic map 1:25,000
- Baseplate compass with a ruler
- Pencil and paper strip for profiles
- Waterproof map case
- Phone with offline maps as backup
- Washable marker for the fist model
FAQ
How do you read contour lines on a map?
What does the contour interval mean?
How can I tell if a slope is steep on a map?
How do I tell a valley from a ridge on a contour map?
What are index contours?
How do I calculate total ascent from contour lines?
Why do contour lines never cross?
Check yourself
Completed6 quick questions from this guide. Nothing is sent anywhere.
Related step-by-step guides
-
 1
-
 1
-
 1